
Data quality decides whether your processes, your analytics and your decisions can be trusted. In a B2B manufacturer or distributor the same product record feeds the ERP, the webshop, the marketplaces, the print catalogue and a string of partner systems, so a single bad value travels everywhere at once. This guide covers the foundations of data quality, the dimensions that define it, how to measure it with concrete KPIs, the relevant ISO standards, and the methods that actually move the needle.
What Is Data Quality?
The definition most practitioners settle on is “fitness for use”. Data is high quality when it is fit for the purpose it is actually used for, whether that is running operations, making a decision or planning ahead. That definition, which goes back to the work of Wang and Strong and of Thomas C. Redman, makes quality context-dependent. The same dataset can be excellent for one purpose and useless for another.
Product data shows this clearly. One record may need to satisfy an engineer who wants exact technical specifications and a buyer who wants a benefit-led description, while also feeding downstream automation and AI. High quality means each of those consumers gets data that is complete, correct and consistent for what they are doing with it.
The Six Dimensions of Data Quality
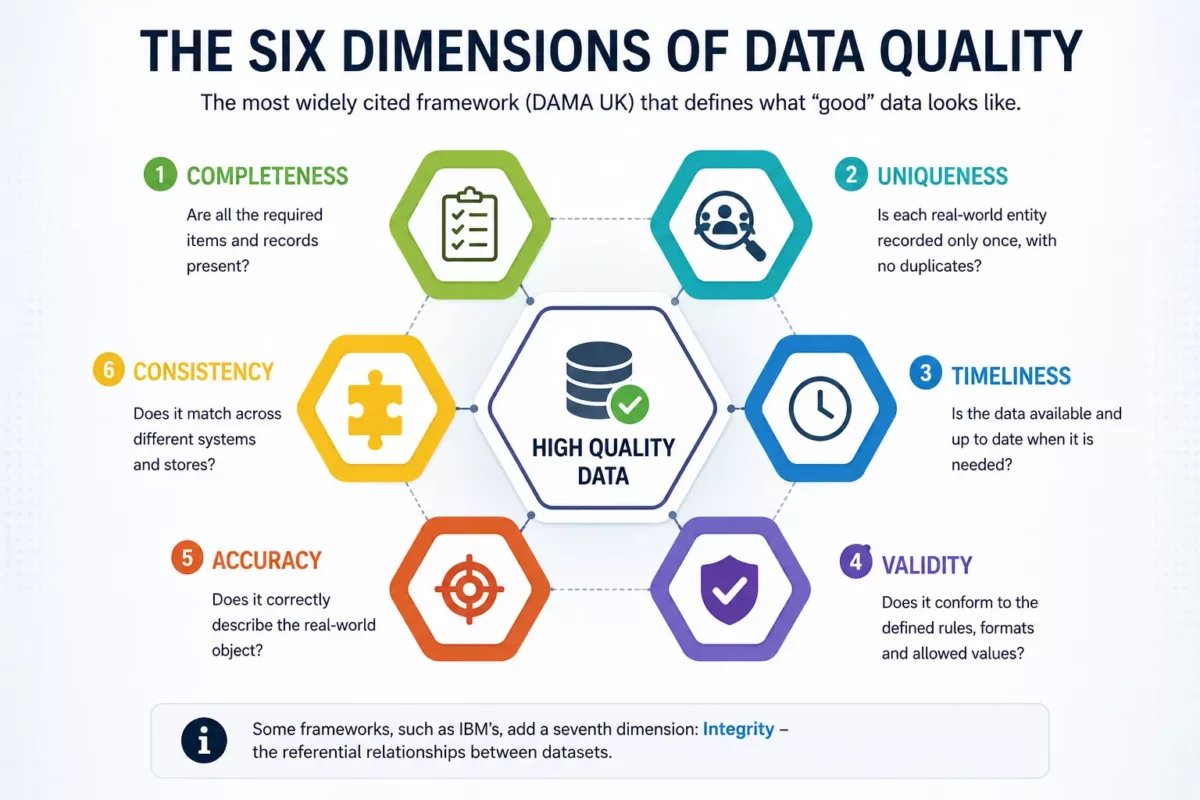
The most widely cited framework comes from the DAMA UK working group in 2013. It gives you a vocabulary for what “good” actually means, which is also what you end up measuring. This is the one place where a compact list beats a paragraph.
Why Data Quality Matters in B2B
Poor data quality carries a price that is easy to underestimate. Gartner puts the average at 12.9 million US dollars per organisation each year. MIT Sloan Management Review reckons most companies lose the equivalent of 15–25 % of revenue to it. Both are estimates, and neither is gospel, but they point the same way: bad data is expensive.
In a manufacturing or distribution setting the cost is rarely abstract. Poor product data drives returns, breaks marketplace listings, kills conversions and creates hours of manual rework. Quality is increasingly a legal duty too: the Digital Product Passport requires complete, correct product data. High data quality, then, is not an IT housekeeping chore. It is a commercial lever, and it is the operational result that good data governance is meant to deliver.
How to Measure Data Quality
You cannot improve what you do not measure, and measurement is what turns the abstract dimensions into numbers you can act on. It usually starts with data profiling, the systematic look at structure, content and relationships that surfaces anomalies and quality issues. From there you define concrete metrics. A completeness rate tells you how many records are free of null values, say 99 % against a target. An error or duplicate rate puts a number on the mess, for example 20 duplicates in 1,000 records, which is 2 %. Accuracy can be expressed as a match rate against a trusted source, and consistency as the share of records that agree across systems. SMART targets keep these honest, something like reaching 95 % completeness for customer data or cutting the error rate by 10 % in six months. A scorecard or dashboard then makes the picture visible across the business, either as a snapshot or as continuous monitoring.
Standards for Data Quality: ISO 8000 and ISO/IEC 25012
Two international standards give data quality a formal backbone. ISO 8000 is the standard for data quality and master data. It defines requirements for exchanging master data, things like product, supplier and asset records, between business partners, and ISO 8000-1:2022 provides the overview, introducing portability as a master-data requirement. ISO/IEC 25012:2008, part of the SQuaRE series, defines a data quality model with 15 characteristics, split between an inherent perspective (accuracy, completeness, consistency, credibility, currentness) and a system-dependent one (accessibility, compliance, traceability, portability and more). Referencing these standards helps you line up internal definitions with a vocabulary other people already recognise.
How to Improve Data Quality
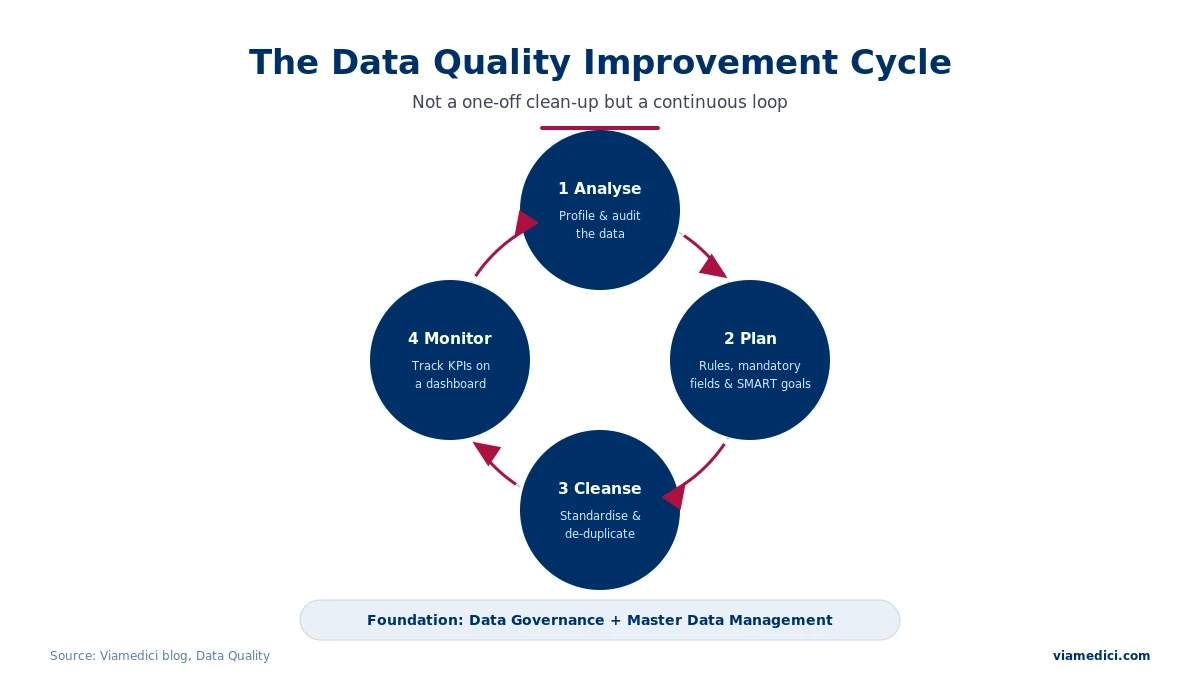
Improving data quality is a cycle, not a one-off clean-up, and the cycle works because it combines people, process and tooling. It begins with analysis: profiling and auditing the current data to locate and quantify the problems. Then comes planning, where you define validation rules, mandatory fields and SMART targets and assign stewardship so someone actually owns the outcome. Cleansing follows, which means standardising formats, removing duplicates (often through fuzzy matching), correcting errors and normalising values. The loop closes with monitoring, tracking the KPIs continuously on a dashboard rather than trusting a one-time check. Underneath all of it sit governance, which supplies ownership and standards, and master data management, which holds a consistent golden record for the core domains. Without those two, cleansed data slowly drifts back out of shape. One effective lever is consolidating onto a single source of truth that removes conflicting copies.
Data Quality and Product Data: How a PIM Helps
For product information, a PIM system is the most direct lever for data quality, because it applies the rules at the source, before anything reaches a channel. Mandatory fields and a completeness score show how complete each product record is against a defined target. Rule-based validation enforces formats, allowed values and dependencies automatically, which is what makes consistency measurable in the first place. Workflows and approvals keep corrections under control before publication, and one governed source feeds different audiences without anyone re-creating the data.
That is exactly how a PIM lifts product information quality in practice. It operationalises the six dimensions for product data and keeps them measurable over time, rather than leaving quality to good intentions.